

Acceleration Spectrum Intensity (ASI) Values for a National Grid of Points in Italy
Description
The Acceleration Spectrum Intensity (ASI; Von Thun et al., 1988) is an engineering parameter that measures the intensity of earthquake ground-motion over selected ranges of structural vibration periods. It is computed as the integral of the 5%-damped pseudo-acceleration response spectrum (PSA) over a specified period range (ΔT). Following the Indirizzi e criteri per la microzonazione sismica (Gruppo di Lavoro MS, 2008), the ASI parameter was evaluated considering three overlapping period ranges as reported in Table 1 (Ordinanza n.24. del Commissario straordinario per la ricostruzione. https://dev.sisma2016data.it/wp-content/uploads/2017/05/Ordinanza-24-del-12-maggio- 2017.pdf; Mori et al., 2020) and illustrated in Figure 1 .
\( \langle ASI_i \rangle = \frac{1}{\Delta T_i}\int_{\Delta T_i} PSA\,dt \)
Table 1. Period ranges and corresponding building heights.| Index | ΔT | Typical Building Height |
|---|---|---|
| ASI1 | 0.1 - 0.5 s | Up to 4 floors |
| ASI2 | 0.4 - 0.8 s | 4-8 floors |
| ASI3 | 0.7 - 1.1 s | More than 8 floors |
 Figure 1. Example of a 5%-damped elastic pseudo-acceleration response spectrum and the three period bands: (left) 0.1-0.5s; (centre) 0.4-0.8s; (right) 0.7-1.1s. The shaded areas within the period bands represent the corresponding ASI values.
The ASI values are evaluated on rock conditions (site class A and flat topography T1) from the Italian Building Code (NTC18) spectra (horizontal component), defined by three parameters (ag, F0, and TC*) on a grid with a spacing of 0.05°, comprising a total of 10,751 grid nodes. To increase the spatial resolution of the ASI estimates, the Italian territory was discretized using a regular grid with a spacing of 500 m, resulting in more than 1.22 million grid points.
Subsequently, to evaluate site-specific ASI values accounting for site effects, the entire Italian territory was classified into NTC18 soil categories and topographic classes according:
- Soil categories (A-D) derived from 1:100,000-scale national lithological map provided by the Italian Institute for Environmental Protection and Research (ISPRA) simplified classification by grouping units characterized by similar lithological and geomorphological conditions.
- Topographic classes (T1-T4) derived from high-resolution digital terrain models (Mascandola at al., 2022)
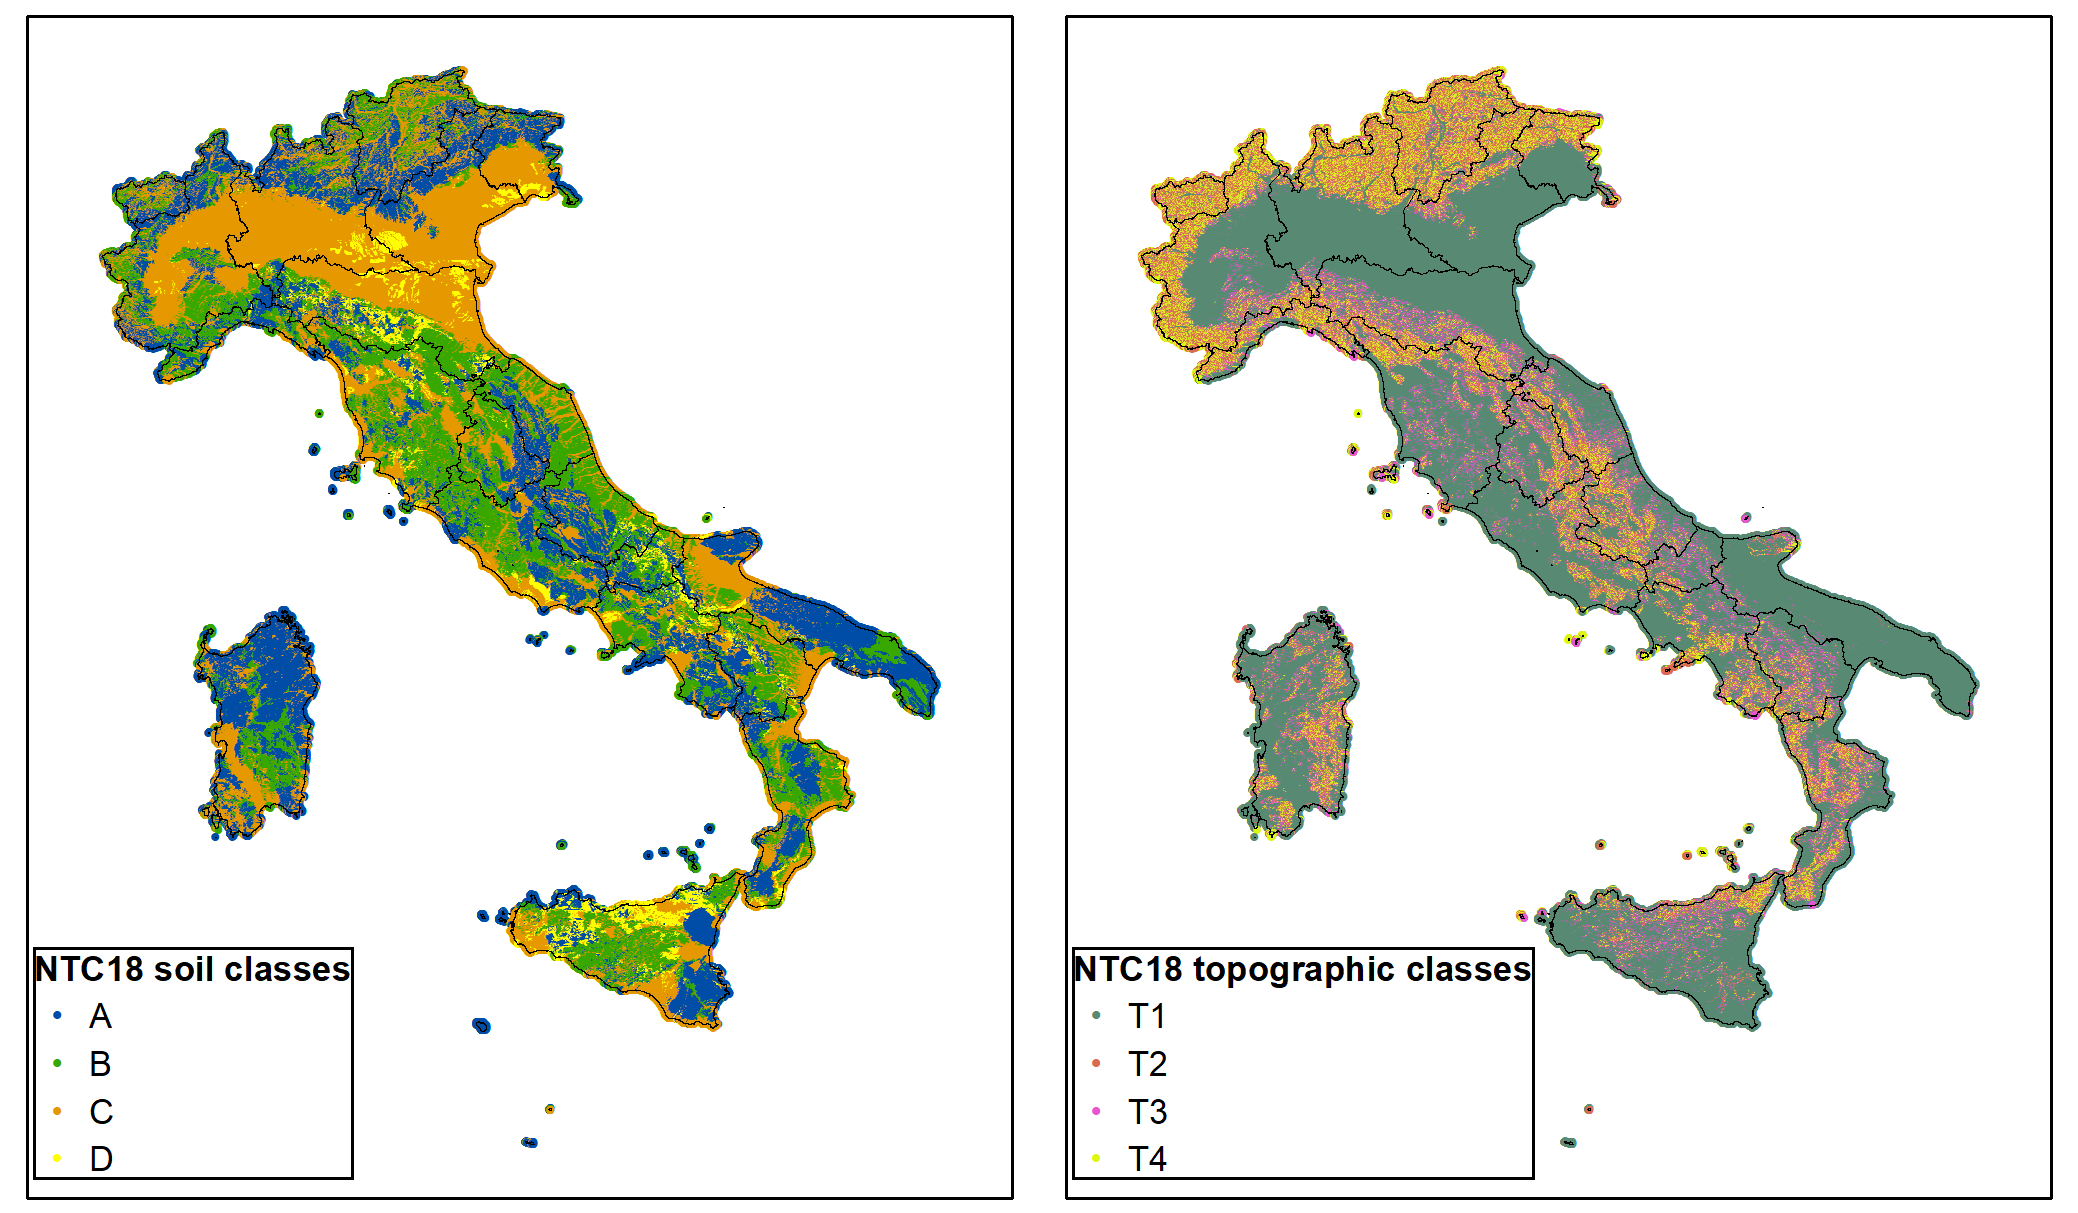 Figure 2. Maps of Italy classified into NTC18 soil classes based on lithological information (left) and NTC18 topographic classes (right).
For each node of the grid, the PSA was computed using the ESM REXEL-target-spectrum Web-Service and according to the NTC18, adopting the following assumptions: use class II (section 2.4.2 of NTC18), nominal design life of 50 years (section 2.4.1 of NTC18), Life Safety Limit State (SLV, section 3.2.1 of NTC18).
In addition to these parameters, which define the reference spectrum on rock, the corresponding subsoil category and topographic class were assigned to each grid point in order to apply the appropriate stratigraphic and topographic amplification factors. The resulting response spectra were then used to assess seismic hazard through the ASI1, ASI2, and ASI3 parameters.
The continuous ASI values were classified into five hazard classes based on the thresholds values provided by the Italian national seismic zonation (OPCM 3519/2006) for different soil category and topographic category T1 (Table 2).
| Hazard Classe | ASI1 [cm/2] | ASI2 [cm/2] | ASI3 [cm/2] |
|---|---|---|---|
| 1 | ASI ≤ 120 | ASI ≤ 75 | ASI ≤ 50 |
| 2 | 120 < ASI ≤ 430 | 75 < ASI ≤ 330 | 50 < ASI ≤ 220 |
| 3 | 430 < ASI ≤ 670 | 330 < ASI ≤ 550 | 220 < ASI ≤ 360 |
| 4 | 670 < ASI ≤ 750 | 550 < ASI ≤ 740 | 360 < ASI ≤ 540 |
| 5 | ASI > 750 | ASI > 740 | ASI > 540 |
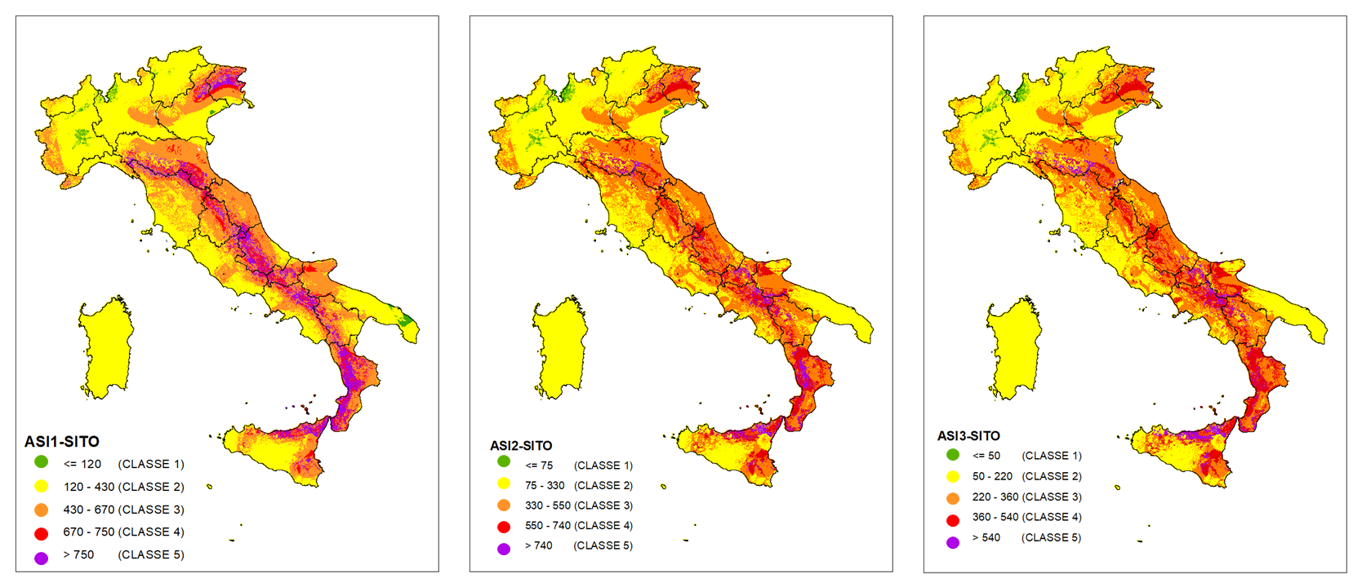 Figure 3. Map of Italy showing the distribution of ASI values for the ΔT1 (left), ΔT2 (centre), ΔT3 (right) period ranges, including local site and topographic effects.
Download
The ASI values are distributed as a .zip file, containing:- the dataset with all the ASI values and the corresponding hazard classes (ASI_1_2_3_italy_2026.csv)
- a supporting file (README.txt) explaining the fields.
- ASI1-ASI2-ASI3 dataset
- md5 checksum: 554bc2ff4d405208d85c240ec71ec431
If you use data from ASI table, please cite as:
Felicetta C., Pacor F., Luzi L., Mascandola C., Sgobba S., Pasetti N. (2026). Acceleration Spectrum Intensity (ASI) values for Italy in three structural period ranges (0.1-0.5s, 0.4-0.8s, 0.7-1.1s). Istituto Nazionale di Geofisica e Vulcanologia (INGV). https://doi.org/10.13127/asi123
Acknowledgments
The ASI values dataset was developed by the Istituto Nazionale di Geofisica e Vulcanologia (INGV) under a contract for research activities and services with ANIA Servizi e Formazione S.r.l. (Associazione Nazionale fra le Imprese Assicuratrici). The resulting data are owned by ANIA Servizi e Formazione S.r.l.
License
 The provided seismic sources information are licensed under the terms of the "Creative Commons Attribution 4.0 International (CC BY 4.0)" License. This means that you are free to share (reproduce, distribute, communicate to the public, publicly display, perform and play this material in any medium and format) and adapt (remix and build upon the material for any purpose, even commercially). The licensor cannot revoke these freedoms as long as you follow the license terms. You must give appropriate credit, provide a link to the license, and indicate if changes were made. You may do so in any reasonable manner, but not in any way that suggests the licensor endorses you or your use. You may not apply legal terms or technological measures that legally restrict others from doing anything the license permits.
This site provides access to Acceleration Spectrum Intensity (ASI) values computed for Italy in three structural period ranges (0.1-0.5s, 0.4-0.8s, 0.7-1.1s). Although analysts have checked all data, no warranty, express or implied, is provided. Every risk due to the improper use of data or the use of inaccurate information is assumed by the user.
References
- Gruppo di Lavoro MS (2008). Indirizzi e criteri per la microzonazione sismica, Conferenza delle Regioni e delle Province autonome-Dipartimento della protezione civile, Roma, 2008, 3 vol. e Dvd.
- Mascandola C., Felicetta C., Russo E., Luzi L., Lanzano G., Sgobba S., Brunelli G., Ramadan F., Pacor F., ORFEUS Strong-Motion SMC (2026). Engineering Strong Motion Database (ESM), version 3.0. Istituto Nazionale di Geofisica e Vulcanologia (INGV). https://doi.org/10.13127/esm.3
- Mascandola, C., Luzi, L., Felicetta, C., & Pacor, F. (2021). A GIS procedure for the topographic classification of Italy, according to the seismic code provisions. Soil Dynamics and Earthquake Engineering, 148, 106848.
- Mori F., Gaudiosi I., Tarquini E., Bramerini F., Castenetto S., Naso G., Spina D. (2020) HSM: a synthetic damage‐constrained seismic hazard parameter. Bulletin of Earthquake Engineering (2020) 18:56315654 https://doi.org/10.1007/s10518-019-00677-2
- NTC18 (2018). Ministero delle Infrastrutture e dei Trasporti. Aggiornamento delle Norme Tecniche per le Costruzioni. Part 3.2.2: Categorie di sottosuolo e condizioni topografiche, Gazzetta Ufficiale n. 42 del 20 febbraio 2018.
- Ordinanza n.24. del Commissario straordinario per la ricostruzione. https://dev.sisma2016data.it/wp-content/uploads/2017/05/Ordinanza-24-del-12-maggio-2017.pdf
- OPCM 3519/2006. Presidenza del Consiglio dei Ministri (2006). Ordinanza del Presidente del Consiglio dei Ministri 28 aprile 2006, n. 3519 Criteri generali per l'individuazione delle zone sismiche e per la formazione e l'aggiornamento degli elenchi delle medesime zone. Gazzetta Ufficiale della Repubblica Italiana, Serie Generale, n. 108, 11 maggio 2006
- Von Thun J.L., Rochim L.H., Scott G.A. and Wilson J.A.; 1988: Earthquake ground motion for design and analysis of dams. In: Earthquake Engineering and Soil Dynamics II - Recent Advance in Ground-Motion Evaluation, ASCE, New York, USA, Geotechnical Special Publ. 20, pp. 463-481.
chiara.felicetta@ingv.it